Most Shopify stores rely only on Facebook or Google ads to drive traffic, some are working on their SEO. But are those efforts always worth it?
If you want to know which channels are really working for entrepreneurs, keep on reading. Then apply what you learned for yourself to grow your sales!
Sixads collected data from more than 60,000 Shopify stores to see what are the main traffic channels that bring in visitors.
Most importantly, we wanted to find out which traffic channels drive the most effective traffic. For instance, both Facebook and Instagram ads may get you the same amount of traffic, but Facebook ads may be generating more sales.
So, let’s find out where you should be getting your traffic from to make the most sales you can!
At first, we will look at the overall findings of all the industries we analysed. If you want to check your niche right away, just click on it in the navigation!
1. Where do visitors come from?
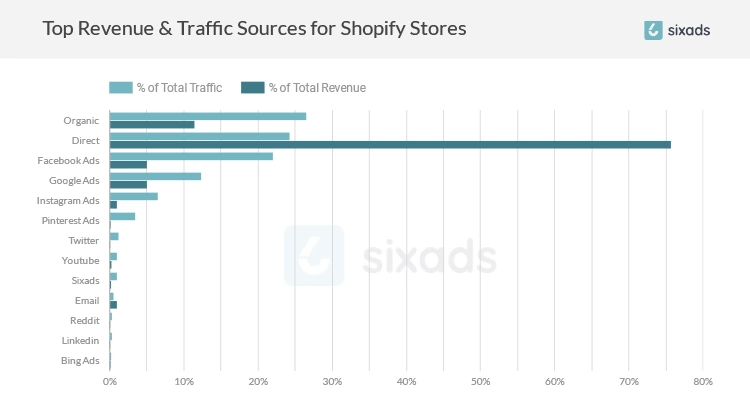
Our research shows that channels that drive the most traffic to over 60,000 analysed Shopify stores are: organic, direct, and Facebook ads.
- Organic stands for visits to your website that come from a search engine’s organic results. It’s the opposite of paid traffic from Google ads, for example.
- Direct refers to the traffic when visitors come right away to your website by typing its URL into their browsers or through browser bookmarks
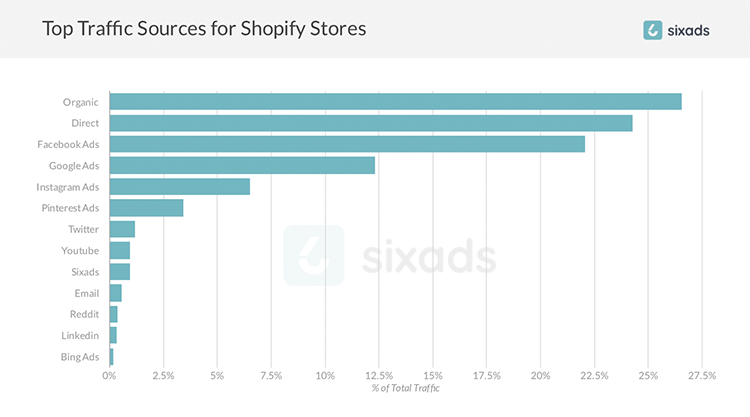
Below you can see the exact numbers (% of total traffic) grouped in a descending order:
- Organic (Google + Yahoo + Bing + others) = 26.56%
- Direct = 24.30%
- Facebook Ads = 22.08%
- Google Ads = 12.32%
- Instagram Ads = 6.56%
- Pinterest Ads = 3.45%
- Twitter Ads = 1.20%
- YouTube = 0.98%
- Sixads = 0.97%
- Email = 0.58%
- Reddit = 0.37%
- LinkedIn = 0.33%
- Bing / cpc = 0.19%
Unfortunately, we found out that (SPOILER ALERT!) not all channels listed above generate as many sales as they do traffic.
2. High traffic from ads doesn’t always mean a lot of sales
Facebook ads bring ⅕ of the total traffic to our analysed Shopify stores. While Google, Pinterest, and Instagram ads drive way less traffic in comparison, these channels combined still account for an essential portion of visitors coming to the online stores. But how much of the total revenue these ad channels bring? Let’s see.
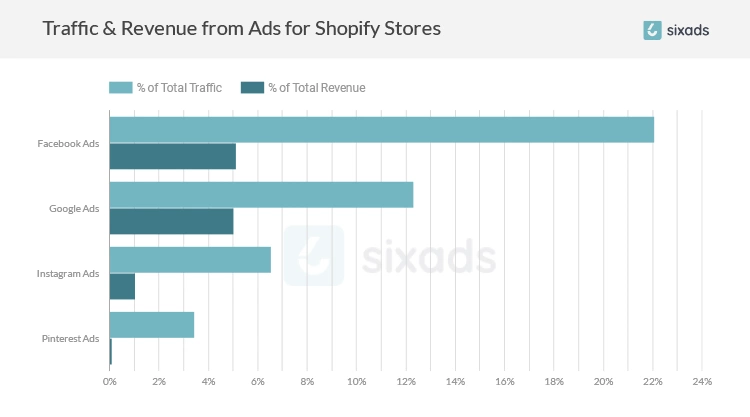
- Facebook ads account for 22.08% of the total traffic but only for the 5.12% of the total revenue.
- Google ads bring 12.32% of the total traffic and 5.12% of the total revenue.
- Instagram ads make up for 6.56% of the total traffic but only bring 1.06% of the total revenue.
- Finally, Pinterest ads drive 3.45% of the total traffic but bring just 0.11% of the total revenue.
How Facebook and Google ads differ in their effectiveness
We discovered that Facebook ads bring almost twice as much traffic as Google ads (22.08% vs 12.32%), however, both of them bring almost identical revenue (5.12% vs 5.04%).
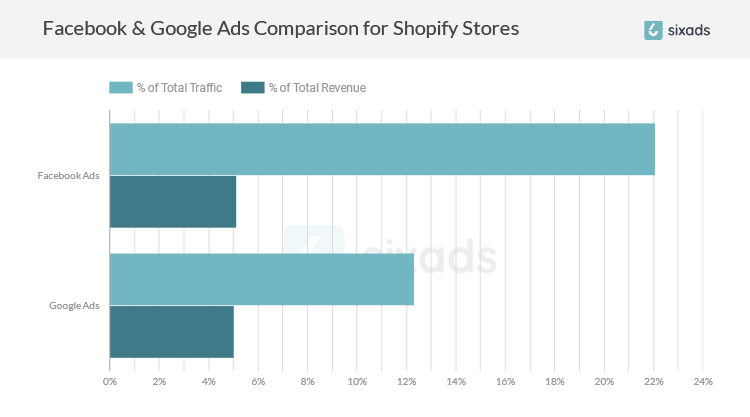
What does this mean to you as a Shopify store owner?
Now, we’re not saying that you should allocate all of your budget to Google ads to bring in traffic and bid farewell to Facebook. Both ad channels are important, you just need to know how to get the most out of them.
The results in the charts above possibly mean these things:
- People might not be very good at setting up their Facebook ads. Many Shopify store owners set up their campaigns for reach, traffic, or even post likes instead of conversions, therefore, they get traffic but almost no sales. Same goes for Instagram ads.
- Google ads are a lot less popular, however they generate almost as much revenue. It could be that this channel is underutilized by a lot of merchants. Also it could mean that a lot fewer shops use it. Maybe only the people with more marketing experience use it therefore they get better results, i.e. sales.
The key here is to combine your Google ads and Facebook ads in a unified strategy so they would complement each other.
3. So, where does the money come from? It’s pretty… direct.
Our findings show that a whopping 75% of the total revenue for Shopify stores comes from the direct traffic (when visitors come right away to your store by typing its URL into their browsers or through browser bookmarks).
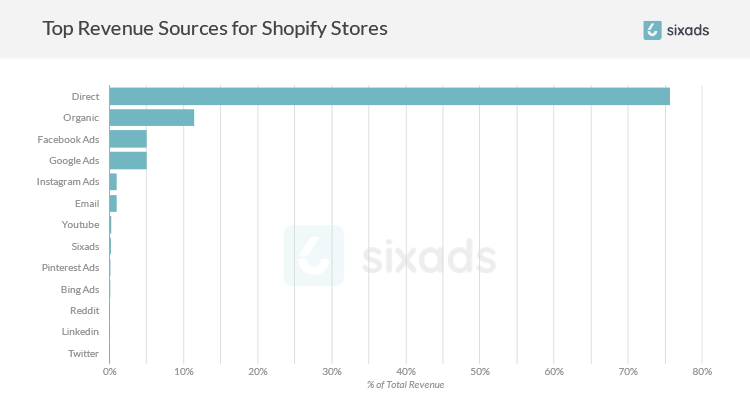
Below you can see the exact numbers (% of total revenue) grouped in a descending order:
- Direct = 75.68%
- Organic (Google + Yahoo + Bing + others) = 11.48%
- Facebook Ads = 5.12%
- Google Ads = 5.04%
- Instagram Ads = 1.06%
- Email = 1.01%
- YouTube = 0.22%
- Sixads = 0.18%
- Pinterest = 0.11%
- Bing / cpc = 0.10%
- Reddit = 0.01%
- LinkedIn = 0.00%
- Twitter = 0.00%
See for yourself how some of the channels bring a lot of traffic but not so much sales. There’s one channel that does the opposite!
Interesting findings:
- While direct traffic accounts for 24.30% of the total traffic, it brings 75.68% of the total revenue! For one thing, this might indicate that customers are most likely to buy from the brands that they already know.
But even a more important thing to note is that people often don’t buy right away after seeing your ad. Many potential customers like to bookmark the link from your ad and come back to it later when they’re ready to buy. This behavior accounts for quite a bit of the direct traffic you’re getting.
TIP #1
Work on your brand awareness and build trust to get more direct traffic. Also, keep in mind that people usually don’t buy from the first time - retarget them with your products’ ads on Facebook to remind them of yourself! Also, make sure that your sales messaging is aligned across different channels so people would recognize you across them.
TIP #2
Create an SEO-based strategy for your online store to increase your brand’s visibility in Google search results.
- Organic traffic still plays a significant role in the marketing funnel: from 26.56% of the traffic it drives, it brings 11.48% of the total revenue! For most Shopify stores, organic traffic comes from branded keywords. So, make sure you have your SEO basics covered so your store could rank for its name!
TIP #3
Work on growing your email list - people coming to the online store from email are interested in buying!
- When it comes to email marketing, email brings a mere 0.58% of the total traffic. And, even though this traffic accounts only for 1.01% of the total revenue, it has the highest ecommerce conversion rate among all other channels (direct only comes in the 5th place, followed by organic in the 6th).
4. Traffic vs Revenue for 5 major Shopify store categories
Up until this point, we’ve covered the overall data of more than 60,000 Shopify stores we’ve analysed. Now, let’s see how traffic and revenue differ among different store categories.
For this analysis, we’ve picked the five biggest categories in terms of revenue from our study:
- Apparel & Accessories
- Electronics
- Home & Garden
- Animals & Pet Supplies
- Health & Beauty
Let’s take a look!
A. Apparel & Accessories

Here are the main subcategories that fall into Apparel & Accessories that we analysed:
Apparel
- Clothing.
- Activewear (bicycle activewear, boxing shorts, dance dresses, skirts & costumes, football pants, hunting clothing, martial arts shorts, motorcycle protective clothing, paintball clothing).
- Baby & toddler clothing.
- Sleepwear & loungewear.
- Swimwear.
- Traditional & ceremonial clothing.
- Underwear & socks.
- Wedding & bridal party dresses.
- Shoes.
Accessories
- Clothing accessories.
- Costumes & accessories.
- Handbag & wallet accessories. Cases.
- Jewelry.
- Shoe accessories.
Just like in the overall data, direct traffic brings the most revenue for Apparel & Accessories. But what stands out is the revenue from organic traffic - it brings a third of the whole revenue! Plus, the traffic from Facebook ads is also very effective.
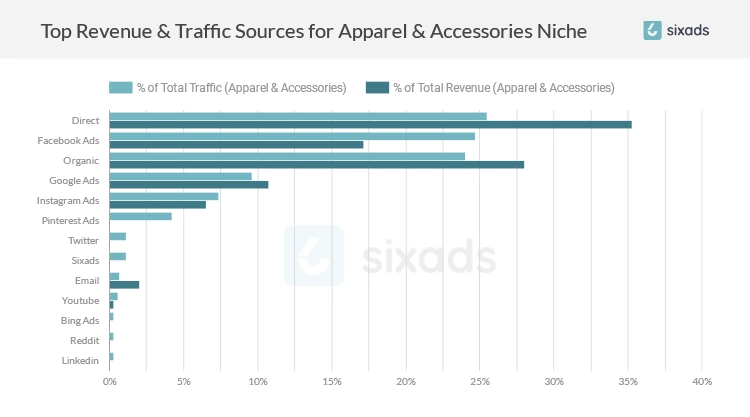
Below you can see the exact numbers (% of total traffic vs % of total revenue) grouped in a descending order:
- Direct = 25.47% vs 35.27%
- Organic (Google + Yahoo + Bing + others) = 24.00% vs 27.99%
- Facebook Ads = 24.72% vs 17.16%
- Google Ads = 9.63% vs 10.77%
- Instagram Ads = 7.38% vs 6.50%
- Email = 0.68% vs 2.02%
- YouTube = 0.56% vs 0.29%
- Sixads = 1.11% vs 0.00%
- Pinterest = 4.22% vs 0.00%
- Bing / cpc = 0.30% vs 0.00%
- Reddit = 0.28% vs 0.00%
- LinkedIn = 0.27% vs 0.00%
- Twitter = 1.15% vs 0.00%
TIP #4
Work on increasing your organic traffic and polish your Facebook ads if you’re selling clothing and accessories!
B. Electronics

Here are the main subcategories that fall into Electronics that we analysed:
- Electronic devices.
- Computers & their accessories.
- Audio & video devices.
- GPS Accessories, navigation systems, tracking devices.
Unlike in the overall data, direct traffic is not in the first place anymore when it comes to revenue. For Shopify store owners selling electronics, organic traffic brings the most revenue. Google ads are also more effective than Facebook ads.
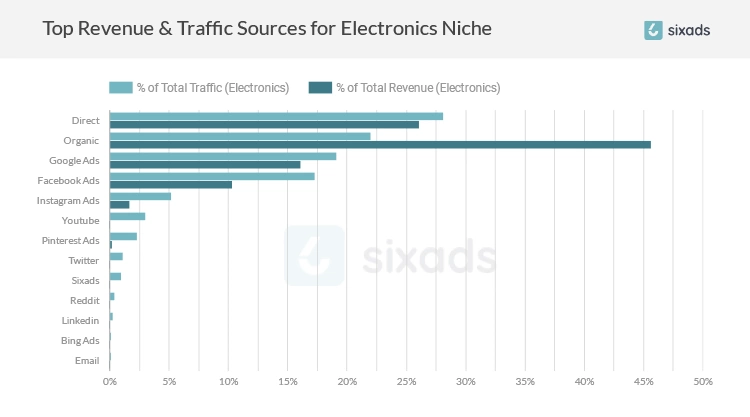
Below you can see the exact numbers (% of total traffic vs % of total revenue) grouped in a descending order:
- Direct = 28.12% vs 26.09%
- Organic (Google + Yahoo + Bing + others) = 22.02% vs 45.64%
- Facebook Ads = 17.27% vs 10.32%
- Google Ads = 19.11% vs 16.09%
- Instagram Ads = 5.20% vs 1.69%
- Email = 0.09% vs 0.00%
- YouTube = 3.00% vs 0.00%
- Sixads = 0.97% vs 0.00%
- Pinterest Ads = 2.34% vs 0.18%
- Bing / cpc = 0.09% vs 0.00%
- Reddit = 0.39% vs 0.00%
- LinkedIn = 0.27% vs 0.00%
- Twitter = 1.13% vs 0.00%
TIP #5
Concentrate your efforts on your SEO and content efforts to increase your organic traffic. As for the main ad channels, allocate the most budget for Google ads, followed by Facebook. Other social media platforms like Instagram and Pinterest don’t work as well for electronics.
C. Home & Garden

Here are the main subcategories that fall into Home & Garden that we analysed:
- Bathroom accessories.
- Furniture.
- Decor (clocks, paintings, household ornaments).
- Household appliances & accessories.
- Household supplies.
- Kitchen & dining.
- Lawn & garden.
- Lighting.
- Linens & bedding.
- Plants.
Home & Garden stands out from the other categories - Facebooks ads bring over 60% of the whole revenue here! The second place of income is taken by organic traffic, then followed by direct. But Facebook still brings more money than those two combined together!
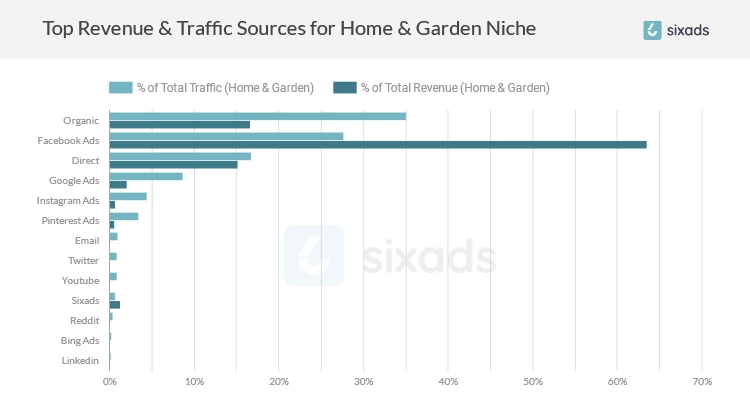
Below you can see the exact numbers (% of total traffic vs % of total revenue) grouped in a descending order:
- Direct = 16.76% vs 15.20%
- Organic (Google + Yahoo + Bing + others) = 35.06% vs 16.62%
- Facebook Ads = 27.62% vs 63.52%
- Google Ads = 8.63% vs 2.07%
- Instagram Ads = 4.40% vs 0.73%
- Email = 0.95% vs 0.00%
- YouTube = 0.85% vs 0.00%
- Sixads = 0.67% vs 1.31%
- Pinterest = 3.47% vs 0.55%
- Bing / cpc = 0.19% vs 0.00%
- Reddit = 0.36% vs 0.00%
- LinkedIn = 0.13% vs 0.00%
- Twitter = 0.90% vs 0.00%
TIP #6
This one is pretty straightforward - step up your Facebook game if you’re selling Home & Garden products!
D. Animals & Pet Supplies

Here are the main subcategories that fall into Animals & Pet Supplies that we analysed:
- Bird, cat, dog, fish supplies.
- Pet agility equipment.
- Pet beds.
- Pet accessories.
- Pet bowls and feeders.
- Pet carriers & crates.
- Pet doors & accessories.
- Pet grooming supplies.
Animals & Pet Supplies really stand out from all of the categories in this research. Organic traffic here brings even more revenue than for Electronics - it accounts for 59.12% of the total revenue! To put things in perspective, by percentage, organic traffic in this niche brings twice as much money than it does traffic.
The second most important channel that brings revenue is Google ads (pet owners really turn to Google to buy things for their furry friends). They’re also loyal email subscribers - email is the third biggest channel here that brings revenue!
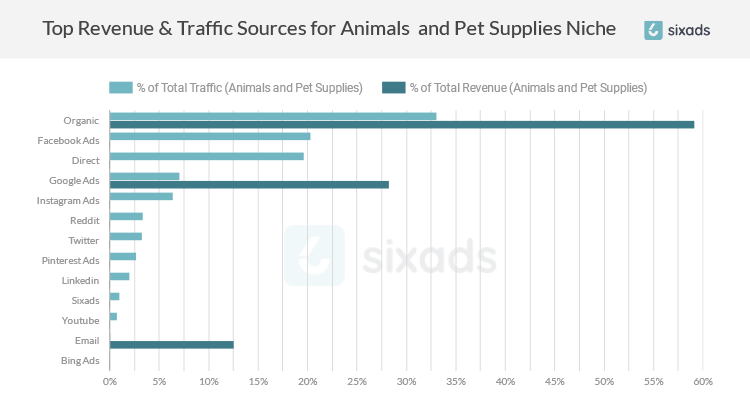
Below you can see the exact numbers (% of total traffic vs % of total revenue) grouped in a descending order:
- Direct = 19.68% vs 0.00%
- Organic (Google + Yahoo + Bing + others) = 33.08% vs 59.12%
- Facebook Ads = 20.33% vs 0.00%
- Google Ads = 7.11% vs 28.30%
- Instagram Ads = 6.40% vs 0.00%
- Email = 0.04% vs 12.58%
- YouTube = 0.76% vs 0.00%
- Sixads = 1.04% vs 0.00%
- Pinterest = 2.70% vs 0.00%
- Bing / cpc = 0.00% vs 0.00%
- Reddit = 3.34% vs 0.00%
- LinkedIn= 2.00% vs 0.00%
- Twitter = 3.32% vs 0.00%
TIP #7
Focus all your efforts in creating useful content for pet owners on your online store, invest in Google Ads, and grow your email list! As for the social media like Facebook and Instagram, allocate a minimum ad budget there.
E. Health & Beauty

Here are the main subcategories that fall into Health & Beauty that we analysed:
- Personal care.
- Cosmetics.
- Hair care.
- Massage & relaxation.
- Sleeping aids.
- Health care.
- Hair care and accessories.
- Jewelry cleaning & care.
For Health & Beauty online stores, the biggest part of revenue comes from direct traffic, followed by the traffic from Facebook and Google Ads respectively. Organic is important, too. But what really stands out here is the revenue from YouTube. While it’s just about 5.62% of the total revenue, other Shopify store categories don’t see anything remotely similar.
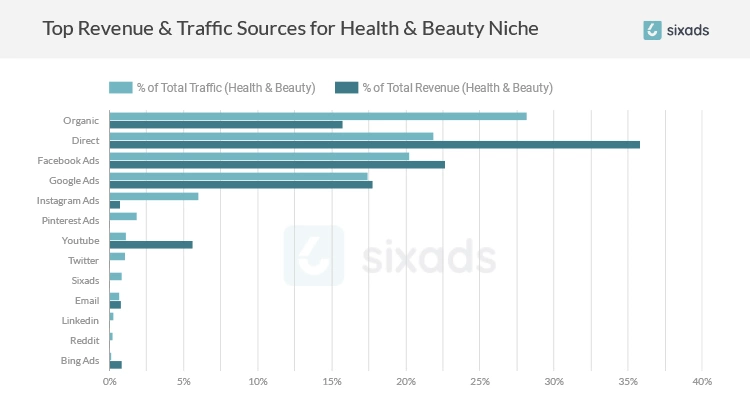
Below you can see the exact numbers (% of total traffic vs % of total revenue) grouped in a descending order:
- Direct = 21.88% vs 35.81%
- Organic (Google + Yahoo + Bing + others) = 28.20% vs 15.75%
- Facebook Ads = 20.27% vs 22.70%
- Google Ads = 17.44% vs 17.76%
- Instagram Ads = 6.01% vs 0.71%
- Email = 0.66% vs 0.79%
- YouTube = 1.10% vs 5.62%
- Sixads = 0.85% vs 0.00%
- Pinterest =1.88% vs 0.00%
- Bing / cpc = 0.11% vs 0.86%
- Reddit = 0.24% vs 0.00%
- LinkedIn = 0.25% vs 0.00%
- Twitter = 1.07% vs 0.00%
TIP #8
Work on increasing your brand awareness and building trust to drive more direct traffic. Invest in useful content creation on your store, run well-thought Facebook and Google ads, and don’t forget to collaborate with YouTube bloggers for referral traffic.
Final advice
Don’t just blindly follow what everyone else is doing with their Shopify stores. Check what actually works in your niche and test it for yourself.
When you find the marketing channel that brings you customers, keep on testing and scaling it. Test different sales messaging, play around with visuals to find the best performing combination. Always look back, evaluate, and repeat for even better results.
Not sure how to go around Facebook or Google ads? Or you want to find more ways to get traffic to test your products cheaper? We’re here to help - just drop us a line.
But, most importantly, before you put your money into advertising, polish your store so it looks professional and trustworthy. Improve your website design, work on getting positive customer reviews for social proof, and make sure your products live up to their promise on your ads. Then, the traffic you’ll be driving will sure bring you money.
Yes, it’s a hustle. But it’s all worth it in the end when you’re in a fancy swimming pool sipping fancy drinks. This could be you.


